Let's try to create a simple infographic starting from an XML
file containing data about the carbon dioxide emissions
in Europe.
The file format is the following:
<dataset>

  <nodes>

    <node>

      <rank>58</rank>

      <country>Norway</country>

      <tonsperson>11.40</tonsperson>

      <tons>52.35</tons>

    </node>

    <node>

      <rank>54</rank>

      <country>Sweden</country>

      <tonsperson>6.53</tonsperson>

      <tons>58.77</tons>

    </node>


    ...


  </nodes>

</dataset>
To position the data on a map, we have to add the latitude and longitude
fields for each european country (we have not to be precise).
<dataset>

  <nodes>

    <node>

      <rank>58</rank>

      <country>Norway</country>

      <tonsperson>11.40</tonsperson>

      <tons>52.35</tons>

      <latitude>62</latitude>

      <longitude>15</longitude>

    </node>

    <node>

      <rank>54</rank>

      <country>Sweden</country>

      <tonsperson>6.53</tonsperson>

      <tons>58.77</tons>

      <latitude>60</latitude>

      <longitude>17</longitude>

    </node>


    ...


  </nodes>

</dataset>
To use the data we have to load them into an XML data source,
using the System.Xml.XmlDataSource object, but the problem is that
the object wants the record fields specified as node attributes, that is the
file format should be:
<nodes>

  <node rank="58" country="Norway" tonsperson="11.40" tons="52.35"


    latitude="62" longitude="15">

  </node>


  ...


</nodes>
To transform the XML document it is not necessary to do it by hand, but we
can use a XSL file (eXtensible Stylesheet
Language) that will contain the XSLT (XSL Transformations) transformation
properties. The file is the following:
<?xml version="1.0"?>

  <xsl:stylesheet

    version="1.0"

    xmlns:xsl="http://www.w3.org/1999/XSL/Transform"

    xmlns:xsi="http://www.w3.org/2001/XMLSchema-instance"

    xmlns:xsd="http://www.w3.org/2001/XMLSchema"

    xmlns:msxsl="urn:schemas-microsoft-com:xslt" >

  <xsl:strip-space elements="*"/>

  <xsl:output method="xml"

    omit-xml-declaration="yes"

    indent="yes"

    standalone="yes" />

  <xsl:template match="/">

    <xsl:for-each select="dataset">

      <xsl:for-each select="nodes">

        <xsl:element name="nodes">

          <xsl:for-each select="node">

            <xsl:element
name="node">

              <xsl:attribute
name="rank">


<xsl:value-of select="rank"/>


</xsl:attribute>

              <xsl:attribute
name="country">


<xsl:value-of select="country"/>


</xsl:attribute>

              <xsl:attribute
name="tonsperson">


<xsl:value-of select="tonsperson"/>


</xsl:attribute>

              <xsl:attribute
name="tons">


<xsl:value-of select="tons"/>


</xsl:attribute>

              <xsl:attribute
name="latitude">


<xsl:value-of select="latitude"/>


</xsl:attribute>

              <xsl:attribute
name="longitude">


<xsl:value-of select="longitude"/>


</xsl:attribute>

            </xsl:element>

          </xsl:for-each>

        </xsl:element>

      </xsl:for-each>

    </xsl:for-each>

  </xsl:template>

</xsl:stylesheet>
Let's create now a new page and insert inside a
System.Web.UI.DataVisualization.Charting.Chart object, specifying a
bubble graph, with two values on the Y axis and no grid or border but a Europe
map as background:
<asp:Chart ID="m_Chart" runat="server" Height="600px" Width="600px" >

  <Series>

    <asp:Series ChartArea="m_ChartArea" Name="m_Series"

      MarkerBorderColor="Brown" ChartType="Bubble"

      MarkerStyle="Circle" YValuesPerPoint="2">

    </asp:Series>

  </Series>

  <ChartAreas>

    <asp:ChartArea Name="m_ChartArea" BackImage="europe.png"


      BackImageAlignment="Center" BackImageWrapMode="Scaled">

      <AxisY LineColor="Transparent">

        <MajorGrid Enabled="False" />

        <MajorTickMark Enabled="False" />

        <LabelStyle Enabled="False" />

      </AxisY>

      <AxisX LineColor="Transparent">

        <MajorGrid Enabled="False" />

        <MajorTickMark Enabled="False" />

        <LabelStyle Enabled="False" />

      </AxisX>

    </asp:ChartArea>

  </ChartAreas>

</asp:Chart>
Let's load the XML document into the
XmlDataSource.
protected void Page_Load(object sender, EventArgs e)
{
XmlDataSource dataSource = new XmlDataSource();
dataSource.DataFile="dataset.xml";
dataSource.TransformFile = "transform.xsl";
XmlDocument doc = dataSource.GetXmlDocument();
...
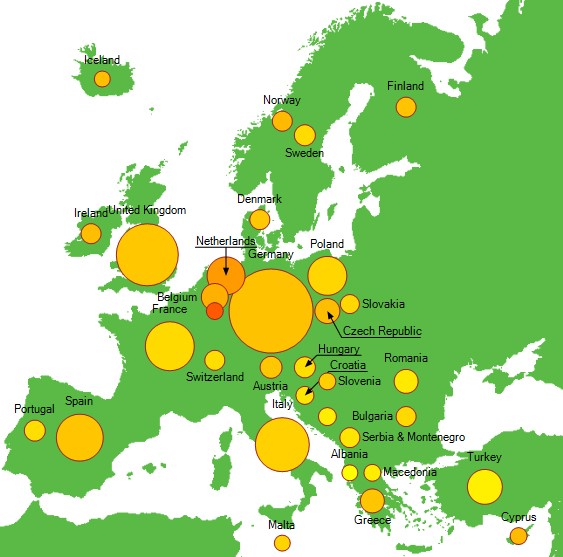
The following code loads the points into the graph, where on the X axis it
uses the longitude, as the first Y value the latitude and as the second Y value
(the bubble radius) the carbon dioxide emissions per
country. The bubble label is the country name. The emissions per person
determine the bubble color, higher values have more red.
To make the algorithm work with every data set and to distribute the
colors evenly, the color calculation is performed in two phases, during
the first scan the minimum and maximum values are determined, during the second
one the values are expanded into the just determined interval.
Note that the decimal separator in the XML file may be different from
the one used by the current operating system, so we have to convert it.
Finally, a short data summary is used for every bubble as a tooltip.
Series series = m_Chart.Series[0];
XmlNodeList nodes = doc.SelectNodes("//node");
Double? minTonsPerson = null;
Double? maxTonsPerson = null;
foreach (XmlNode node in nodes)
{
String country = node.Attributes["country"].Value;
Double latitude = Convert.ToDouble(node.Attributes["latitude"].Value,
CultureInfo.InvariantCulture);
Double longitude = Convert.ToDouble(node.Attributes["longitude"].Value,
CultureInfo.InvariantCulture);
Double tons = Convert.ToDouble(node.Attributes["tons"].Value,
CultureInfo.InvariantCulture);
String tonsPersonStr = node.Attributes["tonsperson"].Value;
Double tonsPerson = Convert.ToDouble(tonsPersonStr,
CultureInfo.InvariantCulture);
if (minTonsPerson.HasValue)
{
if (tonsPerson < minTonsPerson.Value) minTonsPerson =
tonsPerson;
}
else
minTonsPerson = tonsPerson;
if (maxTonsPerson.HasValue)
{
if (tonsPerson > maxTonsPerson.Value) maxTonsPerson =
tonsPerson;
}
else
maxTonsPerson = tonsPerson;
DataPoint point = new DataPoint(longitude, new Double[] { latitude, tons
});
point.Label = country;
point.SetCustomProperty("tonsPerson", tonsPersonStr);
point.ToolTip = String.Format("{0}: {1} milliontons", country, tons);
series.Points.Add(point);
}
foreach (DataPoint point in series.Points)
{
Double tonsPerson = Convert.ToDouble(point.GetCustomProperty("tonsPerson"),
CultureInfo.InvariantCulture);
point.Color = Color.FromArgb(255, Convert.ToInt32(255 - 155 *
(tonsPerson - minTonsPerson) /
(maxTonsPerson - minTonsPerson)), 0);
}